Relationship between mandible fractures and third molars
Article information

Abstract
Background
This study was conducted to determine the relationship between third molar (M3) and mandibular fracture.
Methods
Patients with unilateral mandibular angle or condyle fractures between 2008 and 2018 were evaluated retrospectively. Medical records were reviewed regarding the location of fractures, and panoramic radiographs were reviewed to discern the presence and position of ipsilateral mandibular third molars (M3). We measured the bony area of the mandibular angle (area A) and the bony area occupied by the M3 (area B) to calculate the true mandibular angle bony area ratio (area A–B/area A× 100).
Results
The study consisted of 129 patients, of which 60 (46.5%) had angle fractures and 69 (53.5%) had condyle fractures. The risk of angle fracture was higher in the presence of M3 (odds ratio [OR], 2.2; p< 0.05) and the risk of condyle fracture was lower in the presence of M3 (OR, 0.45; p< 0.05), than in the absence of M3. The risk of angle fracture was higher in the presence of an impacted M3 (OR, 0.3; p< 0.001) and the risk of condyle fracture was lower in the presence of an impacted M3 (OR, 3.32; p< 0.001), than in the presence of a fully erupted M3. True mandibular angle bony area ratio was significantly lower in the angle fractures than in the condyle fractures (p= 0.003).
Conclusion
Angle fractures had significantly lower true mandibular angle bony area ratios than condyle fractures. True mandibular angle bony area ratio, a simple and inexpensive method, could be an option to predict the mandibular fracture patterns.
INTRODUCTION
The mandible is considered the strongest bone in the facial skeleton. However, because of its exposed position and anatomic configuration, traumatic force leading to mandibular fractures are reported to be high, comprising of 76% of all maxillofacial fractures [1-3]. Mandibular fracture patterns depend on multiple factors: the direction and extent of force applied, presence and amount of soft tissue protection, and biomechanical characteristics of the mandible bone itself (such as bone density) [2]. The most frequent mandibular fractures are the mandibular condyles (56.5%), mandibular symphysis (45.0%), body (25.5%), and angle (16.5%) [4].
In relation to the multiple factors, there have been several studies conducted on the influence of the third molar (M3) on mandibular fracture pattern. Tevepaugh and Dodson [1] concluded that mandibular fracture patients with mandibular M3 have a 3.8 times higher risk of angle fractures than patients without M3s. Samieirad et al. [2] concluded that presence of impacted (unerupted or partially erupted) M3s increase the risk of angle fractures and simultaneously decrease the risk of condylar fractures. The condyle has the lowest bone thickness in the mandible structure and is most vulnerable to traumatic injuries [1]. However, in the presence of the M3, this somehow weakens the angle and causes it to become vulnerable to fractures.
Further studies have evaluated the effect of the position of M3 on mandibular fracture patterns. Fuselier et al. [5] concluded that angle fractures have significant relevance to both the angulation and vertical positions of the M3, with mesioangular M3s to be more common in patients with angle fractures. Samieirad et al. [2] showed that the horizontal position of M3 and the mandibular fracture site had significant statistical relevance, with class II being the most common type.
The aim of this study was to evaluate the relationship between the presence and position of M3 and mandibular fracture site (angle or condyle). In addition, the degree of relevance of the position of M3 and mandible fracture pattern differ in existing literature. Therefore, we measured the true bony area of the angle in two dimensions and verified its relationship with the mandibular fracture site (angle or condyle).
METHODS
This is a retrospective study reviewing clinical records, panoramic radiographs, and computerized tomography images of all patients presenting with facial fractures, including mandibular fractures, at a single center during a 11-year period from January 2008 to December 2018. As this study is retrospective in nature, the institutional review board exempted this work from any need for formal approval (2019-07-059). The study was conducted in accordance with the principles of the Helsinki Declaration.
We enrolled patients with unilateral angle or condylar fractures above the age 18 with full medical records and panoramic radiographs. We excluded patients with bilateral or combined angle/condylar fractures, under the age limit, or edentulous cases.
We collected data such as sex, age, mechanism of fracture, direction and location of fracture, presence of an ipsilateral mandibular third molar (M3), impacted (unerupted or partially erupted) or fully erupted M3, and position of M3.
We used Kelly and Harrigan’s definition of mandible fracture. We defined an angle fracture as a fracture located at the retromolar area of the second molar (M2) that extends from any point on the curve formed by the junction of the body and ramus to any point on the curve formed by the inferior border of the body and posterior border of the ramus. A condylar fracture is defined as a fracture line extending over the sigmoid notch [6].
When the mandibular M3 was present, the horizontal/vertical position was defined by the Pell-Gregory classification [7]. The horizontal position of the mandibular M3 was classified by the eruption space between the anterior border of the ramus and the posterior side of the mandibular M2. Class I signifies adequate space available for full eruption, class II signifies inadequate space for eruption, and class III signifies the M3 as completely or mostly within the ramus.
The vertical position was classified according to the highest point of the crown of the M3 as follows: in class A, the point is the same or above the occlusal plane of the M2; in class B, the point is between the cementoenamel junction (CEJ) and the occlusal plane of the M2; and in class C, the point is below the CEJ of the M2.
Based on the Shiller’s method, the angulation was classified by the angle of the occlusal surface between the mandibular M2 and M3 [8]. Angles smaller than 10° were defined as vertical angulation; angles 11°–70° in the mesial direction were considered mesioangular; angles 11°–70° in the distal direction were considered distoangular; and angles over 70° were considered to be horizontal angulation.
We defined impacted (unerupted or partially erupted) M3 as any third molar crown partially or completely covered by bone tissue. We used the term “fully erupted” only when the M3 crown was not covered by the mandibular angle or ascending ramus. A fully erupted M3 would be classified as class 1 for a horizontal position and class A for a vertical position.
Additionally, we measured the bony area of the mandibular angle (area A) and the bony area occupied by the M3 in the angle area (area B) based on panoramic radiography to calculate the true bony area of the mandibular angle (area A–B). The mandibular angle (area A) was bounded by lines 1 and 2. Line 1 was defined as a connection of any point on the curve formed by the junction of the body and the ramus to any point on the curve formed by the inferior border of the body and posterior border of the ramus. Line 2 was defined as a line touching the posterior side of M2 (Fig. 1).
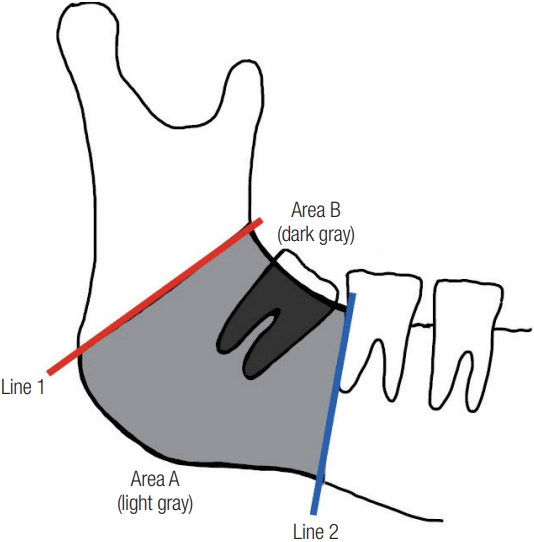
Diagram of radiographical analysis of the angle. Area A; space between lines 1 and 2 (light gray) and area B; osseous space occupied by the third molar (dark gray).
We further calculated the true mandibular angle bony area ratio (area A–B compared to area A) to exclude the mandible angle size discrepancy between patients. We analyzed panoramic radiographs using viewer software (Centricity PACS, Radiology RA1000 Workstation, GE Healthcare, General Electric Company, Boston, MA, USA) and the ImageJ program (National Institutes of Health, Bethesda, MD, USA). Every measurement was rounded off to two decimal places.
We divided the patients into two groups according to whether they had an ipsilateral M3 to the angle or condyle fracture. Group 1 was defined as patients with M3 and group 2 consisted of patients without M3. We evaluated whether the presence of the third molar had an effect on the mandible fracture pattern, angle or condyle.
Then, with only the patients with M3, we divided them into two further subgroups by location of mandibular fractures, angle or condyle. Group 1A was defined as patients with M3 and angle fractures and group 1B as patients with M3 and condyle fractures. We evaluated whether the position of M3 and true mandibular bony area ratio (defined as A–B/A×100) had influence on the mandible fracture pattern.
The database was constructed, and analysis was performed using SPSS software. We calculated the mean (SD), and the significances of differences were assessed using the chi-square test, Student t-test, Mann-Whitney U tests and multiple logistic regression techniques. p-values less than 0.05 were considered statistically significant.
RESULTS
This retrospective study consisted of 129 patients of whom 94 (72.9%) were male and 35 (27.1%) were female. The average age was 35.2±14.5 (SD) years. The main causes of fractures were slip downs (37.2%), assaults (20.1%), and motor vehicle accidents (14.0%).
Among the 129 patients enrolled, 82 patients (63.6%) had an ipsilateral M3 and they were classified as group 1. In group 2 were 47 patients without M3. Age, sex, and mechanism of injury are summarized in Table 1. The statistical analysis showed that group 2 was older than group 1.

Age, sex, and cause of injury in patients with or without ipsilateral third molars (M3)
In group 1, 44 patients (53.7%) had an angle fracture and 38 patients (46.3%) had a condyle fracture. In group 2, 16 patients (34.0%) had an angle fracture and 31 patients (66.0%) had a condyle fracture. The risk of angle fracture was higher in the presence of M3 (odds ratio [OR], 2.2; p<0.05) and the risk of condyle fracture was lower in the presence of M3 (OR, 0.45; p<0.05), than in the absence of M3 (Table 2).

Influence of M3 on mandibular angle and condyle fracture
Among the 82 patients with M3, 44 patients (53.7%) had an angle fracture and they were classified as group 1A. In group 1B were 38 patients with M3 and condyle fractures. The age and sex of the patients are summarized in Table 3. The results showed no relationship between the horizontal and vertical positions of the M3 to the angle or condyle fracture. Vertical angulation was significantly higher in the condyle fractures than in the angle fractures (p=0.028), and mesioangulation was significantly higher in the angle fractures than in the condyle fractures (p=0.034) (Table 3). The risk of angle fracture was higher in the presence of an impacted M3 (OR, 0.3; p<0.001) and the risk of condyle fracture was lower in the presence of an impacted M3 (OR, 3.32; p<0.001), than in the presence of a fully erupted M3 (Table 4).

Summary of group 1 patients with angle or condyle fractures

Influence of impacted M3 on mandibular angle and condyle fracture
The measured bony area of the mandibular angle (area A), the bony area occupied by the M3 in the angle area (area B), and the calculated true mandibular angle bony area ratio (area A–B/area A×100) are summarized in Table 5. The results show that there is significant relevance of area B and true mandibular angle bony area ratio to fracture site. Angle fracture patients had a higher M3 bony area (p=0.002) and lower true mandibular angle bony area ratio (p=0.003) than condyle fracture patients.

Summary of area measurement in group 1 patients with angle or condyle fractures
DISCUSSION
Several studies have reported that patients with impacted mandibular M3s are more likely to have an angle fracture than patients without impacted mandibular M3s [1,2,9-13]. A possible explanation for this relationship is that an impacted M3 weakens the mandible by occupying the osseous space and decreases the quantity of bone and cross-sectional bone area, thereby weakening the mandibular angle area [14]. This hypothesis is supported by Reitzik et al. [15]. They performed a study on monkeys and reported that mandibles with impacted M3 required only 60% of total force needed to fracture a mandible with a fully erupted M3. Our study results also show that the incidence of angle fracture was significantly higher in the patients with than in the patients without an ipsilateral M3, particularly those with an impacted M3 rather than a fully erupted M3. However, as patients’ mandible angle sizes are different and this factor may interfere with our results, we measured the bony area of mandible angle (area A) for each patient. The mean±SD was 813.0±283.5 for group 1 and 715.1±319.0 for group 2 (p=0.074). As there were no significant differences in area A of both groups, the result supports the hypothesis that an impacted M3 is relevant to the risk of angle fracture.
Studies have investigated the relationship between condyle fracture and mandibular M3 [2,9,13]. In agreement with previous studies, our study shows that the risk of condyle fracture was higher in patients without than in those with M3, and lower in patients with an impacted M3 than in those with a fully erupted M3. However, more than half of the patients with condyle fracture had an ipsilateral M3 (55.1%). This may mean that in the aspect of predicting condyle fracture, not only the presence of M3 but also other factors should be considered.
There were several studies investigating the relevance of M3 position and mandible fracture pattern; however, the conclusions were diverse. Gaddipati et al. [10] reported that the risk of mandibular angle fractures are highest in class IIA. Fuselier et al. [5] concluded that angulation and vertical position of the M3 has relevance to angle fracture, with mesioangulation being more common in angle fracture patients. However, Naghipur et al. [14] did not find any relation between the position of M3 to angle or condyle fracture. This raises an opinion that the established classification scheme of the M3 is convenient for describing the position of the M3; however, it is not enough to predict the mandibular fracture pattern.
In our study, vertical angulation showed a significant relevance to condyle fractures rather than angle fractures, and mesioangulation showed a significant relevance to angle fractures compared with condyle fractures. However, no relationship was found between the horizontal and vertical positions of the M3 to the angle or condyle fractures. Horizontal and vertical positions only have one-dimensional component (X or Y axis), but angulation or impacted M3 or fully erupted M3 of our definition have two-dimensional components (with both X and Y axis). By combining our results, one-dimensional direction seems insufficient to explain the role of M3 in angle or condyle fractures.
Therefore, the authors hypothesized that the bigger the space occupied by the M3 in the mandibular angle, it would weaken the angle and in other means protect the condyle from fracture. With this hypothesis, the authors measured the true mandibular angle bony area ratio and the results showed significant relevance to fracture pattern. Higher true mandibular angle bony area ratio was significantly lower in the angle fractures than in the condyle fractures (p=0.003).
The authors cautiously claim that this method can be used to predict the mandibular fracture pattern before actual traumatic injury to the mandible bone. Prediction of mandibular fracture pattern is required for the accurate reduction and repair of mandibular condyle fractures as they are more difficult than angle fractures as a result of having the risk of facial nerve injury. Therefore, strengthening the mandibular angle region by removing the M3, making the condyle more vulnerable to traumatic force, might not be appropriate.
A study of Iida et al. [11] is similar to ours; there are some differences between the studies. First, Iida et al. used a wider definition for mandibular angle. They defined the bony space of the angle is the anterior border as the line that touches the posterior side of the M2 and the upper border as the occlusion line lengthened across the ascending ramus. However, they defined angle fracture as a fracture located posterior to the M2 and located at any point on the curve formed by the junction of the horizontal and the posterior border of the ascending ramus. The authors believe that this spatial discrepancy in defining the angle fracture and the actual area measured as mandibular angle caused potential deviation leading to a result showing that there was no significant difference between the mean percentage of remaining bony space in groups with or without angle fractures.
Our study has limitations that should be addressed in following studies. First, as the mandible bone and M3 compose a three-dimensional (3D) space, studies regarding three dimensions should be progressed. However, by using panoramic radiographs that are much less expensive than 3D-computerized tomography images, if we find a consensus in predicting fracture pattern, it would be much more cost-effective.
Secondly, mandibular third molars are seen more frequently in younger patients because the possibility of removing the M3 is higher in older age. We believe that this is the reason why our results showed significant differences among the different ages in the two groups (1 and 2) and also for the two subgroups (1A and 1B). However, as old age cannot be unrelated to a decrease in bone density, further studies controlling this factor will be needed.
In agreement with previous studies, an impacted M3 increased the risk of angle fractures and lowered the risk of condyle fractures compared to an absent M3 or fully erupted M3. In addition, our study showed that angle fractures had lower true mandibular angle bony area ratios than condyle fractures. With further studies, true mandibular angle bony area ratios could be an option to predict the mandibular fracture patterns.
Notes
Conflict of interest
No potential conflict of interest relevant to this article was reported.
Ethical approval
As this study is retrospective in nature, the Institutional Review Board of Konkuk University Medical Center exempted this work from any need for formal approval (IRB exemption number: 2019-07-059). The study was conducted in accordance with the principles of the Helsinki Declaration.