


INTRODUCTION
The malar eminence, the most projected and prominent feature of the zygomatic bone, is of particular interest in various surgical fields. It also affects the masculinity or femininity of the facial appearance. The literature in anthropology has reported that there is a significant quantitative difference in facial features across sex and race [1-6]. Surgical anatomy, morphology, and landmarks of the malar eminence are the most important features to be aware of before undertaking reduction malarplasty, which is one of the procedures of choice for facial recontouring.
Reduction malarplasty is one of the most commonly requested procedures to perform on patients who wish to enhance their feminine facial appearance and to achieve male-to-female transsexualism [7-9]. Accurate preoperative planning and objective analysis of the zygomatic summit can help improve postoperative results [10,11]. As a part of preoperative planning, obtaining accurate information that describes the malar region, especially the skeletal component, is essential for predicting the soft tissue facial contour and the difference across sexes to create a desirable feminine facial appearance.
This study provided such information using combined two-dimensional (2D) computed tomography (CT) and three-dimensional (3D) CT in evaluating the zygomatic summit, which offers a quantifiable method to evaluate the bony components of the zygomatic complex [10-12]. 3D CT is able to focus only on the malar bone by excluding other parts of the facial bone when identifying the zygomatic summit which leads to a more accurate evaluation.
The objectives of this study aimed to quantitatively evaluate the location of malar prominence across sexes in the Southeast Asian population, and identify sex-specific differences in malar prominence for the purpose of facial feminization surgery using a combination of 2D CT and 3D CT. We hypothesized that the sex-specific differences in malar prominence in the Southeast Asian population occur in various aspects: horizontal dimension, vertical dimension, and projection in 3D and summit width, facial width, and malar distance in 2D.
METHODS
Description of the data
This was a retrospective descriptive study of 101 adult Thai patients, conducted in 52 men and 49 women who were at least 20 years old. All patients received a consent form under the study protocol approved by the Institutional Ethics Committee of Lerdsin Hospital (EC approval number: 601004). These patients underwent a 2D CT examination (axial, coronal, and sagittal planes) of the facial bone from September 2014 to September 2018; the 2D CT examination was conducted due to the suspicion of facial bone fractures. Patients who presented maxillary fractures, zygomatic fractures, congenital craniofacial anomalies, or underwent prior surgery of the facial bone were excluded from this study. Osirix 10.0.5 software (Pixmeo, Geneva, Switzerland) was used to create 3D images from the 2D images. All images were interpreted by a radiologist.
Measurement procedures
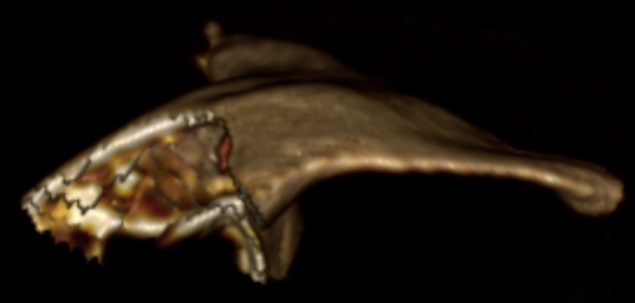
The zygomatic summit is the most prominent point of the zygoma. The zygomatic bone was separated from the remaining facial bone in a 3D fashion (Fig. 1). The second author (PS) identified the summit by examining 3D CT images. Each 3D CT image was precisely rotated three times to identify the zygomatic summit; in each rotation, the numerical value that indicates the position was documented. The position of the zygomatic summit was then calculated by determining the arithmetic mean of the three values. In addition, the summit point was marked for evaluation of the 3D CT images (Fig. 2) and 2D CT images (Fig. 3).
Measurement in 3D images
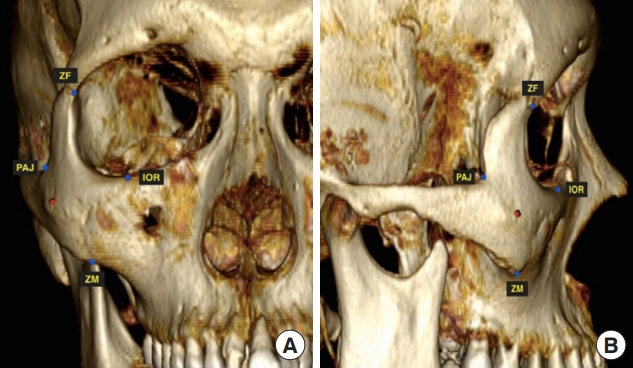
Four landmarks were created as reference points in the 2D CT images and transferred to 3D images (Fig. 4). They consisted of (1) the zygomaticofrontal suture (orbital wall), (2) the midpoint of the inferior orbital rim, (3) the zygomaticomaxillary junction, and (4) the junction between the frontal process and the zygomatic arch (process-arch junction, PAJ). The four reference points were joined by lines, creating a rectangle that denotes the location of the zygomatic summit (Fig. 5). The rectangle is a product of reference points that originate from the zygoma bones, not from the cranium itself; hence, varying cranial sizes (i.e., larger in males compared to females) do not interfere with the numeric output. In other words, this is a standardizing method. The positional relationship between the zygomatic summit and the four reference points was evaluated with 3D CT imaging to examine the horizontal dimension, vertical dimension, and projection (Fig. 5). The numeric values for the positional relationship were calculated as a ratio in proportion to the size of the rectangle, which represents the reference points to allow for comparisons between sexes.
Measurement in 2D images
The summit width (the distance between the zygomatic summit) and the facial width (the distance between the widest points of the zygomatic arches) were evaluated with 2D CT imaging, where raw numeric values were used to compare sexes. The summit-to-facial width ratios were also calculated from the axial view to reveal the relationship between the summit and the cranial width (Fig. 3). The malar distance, which is the distance from the intersection between the X-line and the Y-line (midpoint of the cranium) to the point of the zygomatic summit, was also measured (Fig. 3).
Statistical analysis
The distance, average and standard deviations were calculated for the male and female groups. Statistical analysis was conducted with SPSS version 22 for Windows (IBM Corp., Armonk, NY, USA). The independent-samples t-test was used to evaluate the differences in these values between the groups, and a p-value <0.05 was considered to be statistically significant. The intraclass correlation coefficients (ICCs) were calculated using the two-way mixed-effects model, single measurement, and absolute agreement criteria to demonstrate the intrarater reliability for each measurement. ICCs estimates with 95% confidence intervals were also calculated using SPSS. An ICCs score of <0.40 was considered poor, 0.40–0.59 fair to moderate, 0.60–0.74 good, and ≥0.75 excellent.
RESULTS
The mean age of the patients was 36.54±14.08 years (range, 20–81 years) for male patients and 43.86±15.83 years (range, 20–77 years) for female patients. Age was not significantly different between sexes (p=0.053).
Table 1 presents the range, average, and standard deviation (SD) of the 3D parameters horizontal dimension, vertical dimension, and projection, and Table 2 presents the range, average, and SD of the 2D parameters malar distance, summit width, facial width, and summit-to-facial width ratio, with an intrarater reliability for each measurement.
The results from the 3D CT images indicate that the zygomatic summit in the male group is located more laterally (p<0.01), where the difference is 1.66 mm on average. Conversely, the projection in the female group was found to have a higher projection (p=0.010), but the difference was only 0.16 mm on average. There was no statistically significant difference in the vertical dimension between the two groups (p=0.273). However, a higher vertical dimension was observed in the male group, with a 0.42 mm difference.
For the results from the 2D CT images, there were statistically significant differences in all the parameters (p<0.001); they were all higher in the male group (Table 2). However, there was no statistically significant difference in the summit-to-facial width ratio, which indicates that the overall cranial size in the male group was larger than that in the female group. The differences between groups were 4.3 mm, 5.1 mm, and 7.5 mm on average for malar distance, summit width, and facial width, respectively.
DISCUSSION
Aesthetically pleasing facial features vary depending on cultural perceptions. In many Asian countries, a malar protrusion or a wide and prominent malar is associated with a masculine face and is perceived as a sign of aging [13-15] in contrast to female Caucasians, who prefer a generally heart-shaped face with prominent, well-defined cheeks and more projection. For this reason, malarplasty has become one of the most popular cosmetic operations in Asian countries. Since the malar is an essential feature that contributes to the feminine look, if the exact point of the zygomatic summit (malar prominence) is identified and well described, then an aesthetically pleasing female face could be better created. This issue leads to the objective of this study to evaluate the location- and sex-specific differences of the zygomatic summit.
There are various methods in the process of evaluating the zygomatic summit. Assessment from photographs, plain film, or even directly from the patients in the form of 2D images has been conducted in the past. These studies have provided data demonstrating zygomatic morphology and malar eminence evaluation and revealed various methods for 2D facial analysis of soft tissue or bony landmarks via examination of the patients’ facial contour, evaluation of photographs, cephalometry, plain X-ray, or CT. The limitations of previous methods were that they were difficult to use, impractical, and less accurate. Currently, CT is the imaging method of choice to assess the facial skeleton. Since 2D CT data cannot be rotated and thus lack flexibility during an inspection, it is challenging to explore the zygomatic summit in detail. The malar bone is an important facial region that is known to differ across sexes. However, it is difficult to examine it accurately using 2D data due to the complexity in selecting the axial view where the zygomatic summit is situated. It is important to highlight that the female face is significantly different from the male face not only in the soft tissue but also in the facial skeleton; therefore, a 2D facial analysis data presents an incomplete picture since only the soft tissue is taken into account, disregarding the overall structure of the facial skeleton, which led to inaccurate preoperative planning. 3D CT was later introduced for skeletal assessment to improve accuracy; however, each method has its advantages and disadvantages.
Generally, a 2D CT has significantly better reproducibility than does a 3D CT despite the similarities in their accuracy. In addition, a 2D CT can clearly demonstrate landmarks without interference from adjacent structures. Thus, it has been suggested that a 2D CT is appropriate for the identification and isolation of landmarks. In this study, we performed measurements and identified landmarks using 2D CT, which concurred with previous literature regarding its advantages. However, a 2D CT has limitations when the zygomatic summit is the point of interest. We found that when using 2D CT, the zygomatic summit was inaccurately identified because the exact plane was difficult to locate with 2D CT due to its static nature. However, a 3D CT provides greater freedom of movement, as the CT can be rotated to find the point of prominence, guided by the zygomatic bone contour. In short, a 2D CT and a 3D CT should be used for different purposes. That is, a 2D CT is best for the identification and isolation of landmarks, while a 3D CT is best for locating the zygomatic summit. In this study, the authors included both 2D and 3D CT in the measurement process to obtain greater accuracy and to mitigate the disadvantages of each technique.
The results from the 3D measurements show that the zygomatic summit was located more laterally in the male group and had a higher projection in the female group with statistical significance. The average of these differences was 1.66 mm and 0.16 mm, respectively. Although we established statistical significance in the projection between the two groups, no clinical significance was evident in terms of surgery. While the vertical dimension was similar between the groups, we observed that the zygomatic summit of the male group had a tendency to be higher but did not display any significance in contrast to the results from Nagasao et al. [10]. In the 2D measurements, malar distance, summit width, and facial width were all significantly higher in the male group with differences of 4.3, 5.1, and 7.5 mm, respectively, but the ratio between the summit width and facial width was similar between the two groups, indicating that the male cranium is larger in size. It can be concluded that the zygomatic summit was wider in the Asian male group and more projected in the Asian female group. According to the knowledge of facial skeletal contours in Caucasians, the Caucasian female face demonstrates a wider point of malar prominence [16,17]; however, the results of this study suggest otherwise in Southeast Asians.
Procedures involving reduction malarplasty, or facial feminization, rely on moving or shaving the most prominent point of the zygomatic bone. Based on the results of our study, reduction malarplasty in the Southeast Asian population should comprise a reduction in the horizontal dimension of the malar bone, and the malar distance should be decreased when performing facial feminization surgery. Moreover, if one could locate the soft tissue summit corresponding to the skeletal summit and find their relationship, the operating results would be more accurately predicted.
The localization of the zygomatic summit in each study varied since the greatest prominence of the zygomatic bone is sometimes hard to identify as an exact point. After a thorough observation and evaluation of the zygomatic summit with 3D CT, the zygomatic bone has a unique surface and curvature in terms of convexity and concavity, so we suggest that the zygomatic summit might be an area rather than an actual point that can be precisely detected. We suggest that the area be moved to a more medial location, which ultimately helps to enhance the creation of a feminine face.
There are several limitations in this study. First, the results may not be completely representative of the Southeast Asian population since the subject pool only consisted of Thai patients. We recommend that our study be replicated with patients from other Southeast Asian countries to create a more balanced sample pool. Furthermore, interrater reliability was not assessed in this study, which could affect the validity of the measurements. Therefore, future studies in this area are encouraged to undergo a reliability test. Last, we only revealed the differences in skeletal components of the malar regions without correlating them to the soft tissue. If the correlation was also taken into account, we believe that a more accurate result could be obtained.