Discrepancy of the location of depression on the soft tissue and the bone in isolated zygomatic arch fracture
Article information

Abstract
Background
When performing reduction of zygomatic arch fractures, locating the inward portion of the fracture can be difficult. Therefore, this study investigated the discrepancy between the locations of the depression on the soft tissue and bone and sought to identify how to determine the inward portion of the fracture on the patient’s face.
Methods
We conducted a retrospective review of chart with isolated zygomatic arch fractures of type V in the Nam and Jung classification from March 2013 to February 2022. For consistent measurements, a reference point (RP), at the intersection between a vertical line passing through the end point of the root of the ear helix in the patient’s side-view photograph and a transverse line passing through the longest horizontal axis of the external meatus opening, was established. We then measured the distance between the RP and the soft tissue depression in a portrait and the bone depression on a computed tomography (CT) scan. The discrepancy between these distances was quantified.
Results
Among the patients with isolated zygomatic arch fractures, only those with a fully visible ear on a side-view photograph were included. Twenty-four patients met the inclusion criteria. There were four types of discrepancies in the location of the soft tissue depression compared to the bone depression: type I, forward and upward discrepancy (7.45 and 3.28 mm), type II, backward and upward (4.29 and 4.21 mm), type III, forward and downward (10.06 and 5.15 mm), and type IV, backward and downward (2.61 and 3.27 mm).
Conclusion
This study showed that discrepancy between the locations of the depressions on the soft tissue and bone exists in various directions. Therefore, applying the transverse and vertical distances measured from a bone image of the CT scan onto the patient’s face at the indicated RP will be helpful for predicting the reduction location.
INTRODUCTION
Zygomatic arch fractures are a common injury to the face, with isolated arch fractures making up 10% of all zygoma fractures and 5% of all facial bone fractures [1]. The zygomatic arch is the lateral prominence of the cheek and plays a role in mouth opening and mastication. It also provides an origin for the masseter muscle on its lower border and protects the temporalis muscle, which is inserted onto the coronoid process of the mandible [2].
Isolated zygomatic arch fractures are typically repaired through closed reduction, either through the temporal or intraoral approach, when they cause difficulty in mouth opening or deform the contour [3]. However, the surgical outcomes of closed reduction for these fractures can often be poor due to the difficulty of accurately determining the location of maximal medial displacement of the fracture due to swelling around the site.
Therefore, we conducted this study to investigate tendencies in the discrepancy between the locations of the depression on the soft tissue and bone. On that basis, we sought to identify how to determine the actual location of maximal medial displacement of the fracture in the patient’s face using a computed tomography (CT) scan convertible from a 3-dimensional (3D) bone image to a 3D soft tissue image.
METHODS
We conducted a retrospective review of a series of patients with isolated zygomatic arch fractures corresponding to type V in the Nam and Jung classification [4] between March 2012 and February 2022. In order to evaluate whether there was a discrepancy in the gap between the most depressed location on the preauricular area (judged at the point where reduction would be done based on a photograph) and the location of maximal medial displacement of the fracture on the bone in CT images, we established a reference point (RP) for consistent measurements, and from that point, measured the transverse and vertical distances both on photographs and on the bone images of 3D CT, respectively. The values of distance measured on the photographs were corrected using the ratio of the side ear length between the photograph and the soft tissue image of 3D CT. All CT images in this study were taken from the same PACS viewer (INFINITT PACS Version 3.0.11.3 BN105; INFINITT Healthcare).
To establish the RP, we first drew a vertical line passing through the end point of the root of the ear helix in the patient’s side-view photograph, as well as a transverse line passing through the longest horizontal axis of the external meatus opening. We then used the point where the two lines intersected as the RP for measurement. Next, we measured the ear length (pEL), the transverse distance (T), and the vertical distance (V) from the RP to the most depressed location of the soft tissue (pDP) along the preauricular area on a side-view photograph (Fig. 1).

The reference point (RP) for measurement was set on a photograph. (A) A schematic drawing of the endpoint of the root of the ear helix (a), the longest horizontal axis of the external meatus opening (b), and the RP where the two lines intersect. (B) A vertical line was drawn passing through the endpoint of the root of the ear helix, and a transverse line that passed through the longest horizontal axis of the external meatus opening in the patient’s side-view photograph, and the point where the two drawn lines crossed was used as RP for measurements. (pEL), (T), and (V) denote the ear length on the side-view photograph and the transverse and vertical length from RP to the most depressed portion on the side-view photograph of the patient (pDP) separately before correction using the size ratio between the photograph and computed tomography image.
Subsequently, we measured the ear length (ctEL) and pointed out the RP on the 3D soft tissue images in the same way, and after converting the soft tissue image into a bone image on the same screenshot of the CT scan, we measured the transverse distance (t) and vertical distance (v) from the RP to the actual inward portion of the fracture of the zygomatic arch (bDP) using the ruler tool on the CT imaging program (PACS version 3.0.11.3 BN105; INFINITT Healthcare) (Fig. 2). The values of distance (V, T) measured from the photo were corrected into actual lengths (aT, aV) for each patient, using the ratio of the side ear length between the photo and 3D soft tissue image.

The reference point (RP) was set on the 3-dimensional (3D) reconstruction format of a computed tomography (CT) scan. (A) The RP was established in the same way on the side-view soft tissue images adjusted in the same profile as the side-view photograph. (B) Since the actual length can be measured using the ruler tool on the CT imaging program, the ear length (ctEL), transverse distance (t) and vertical distance (v) from the RP to the actual inward portion of the fracture of the zygomatic arch (bDP) could be measured after converting a soft-tissue image in the 3D reconstruction format into a bone image in the same screenshot.
For example, if the ear length (pEL) on a photograph was 47.40 mm and the ear length (ctEL) on the 3D CT soft tissue image was 55.10 mm, the correction ratio would be 1.16. Then, if the measured values of the transverse distance (T), and the vertical distance (V) from the RP to the most depressed location of soft tissue (pDP) on the photograph were 43.70 and 2.00 mm, respectively, the actual length of T (aT) and V (aV) would be corrected to 50.84 and 2.32 mm, respectively (Fig. 3).
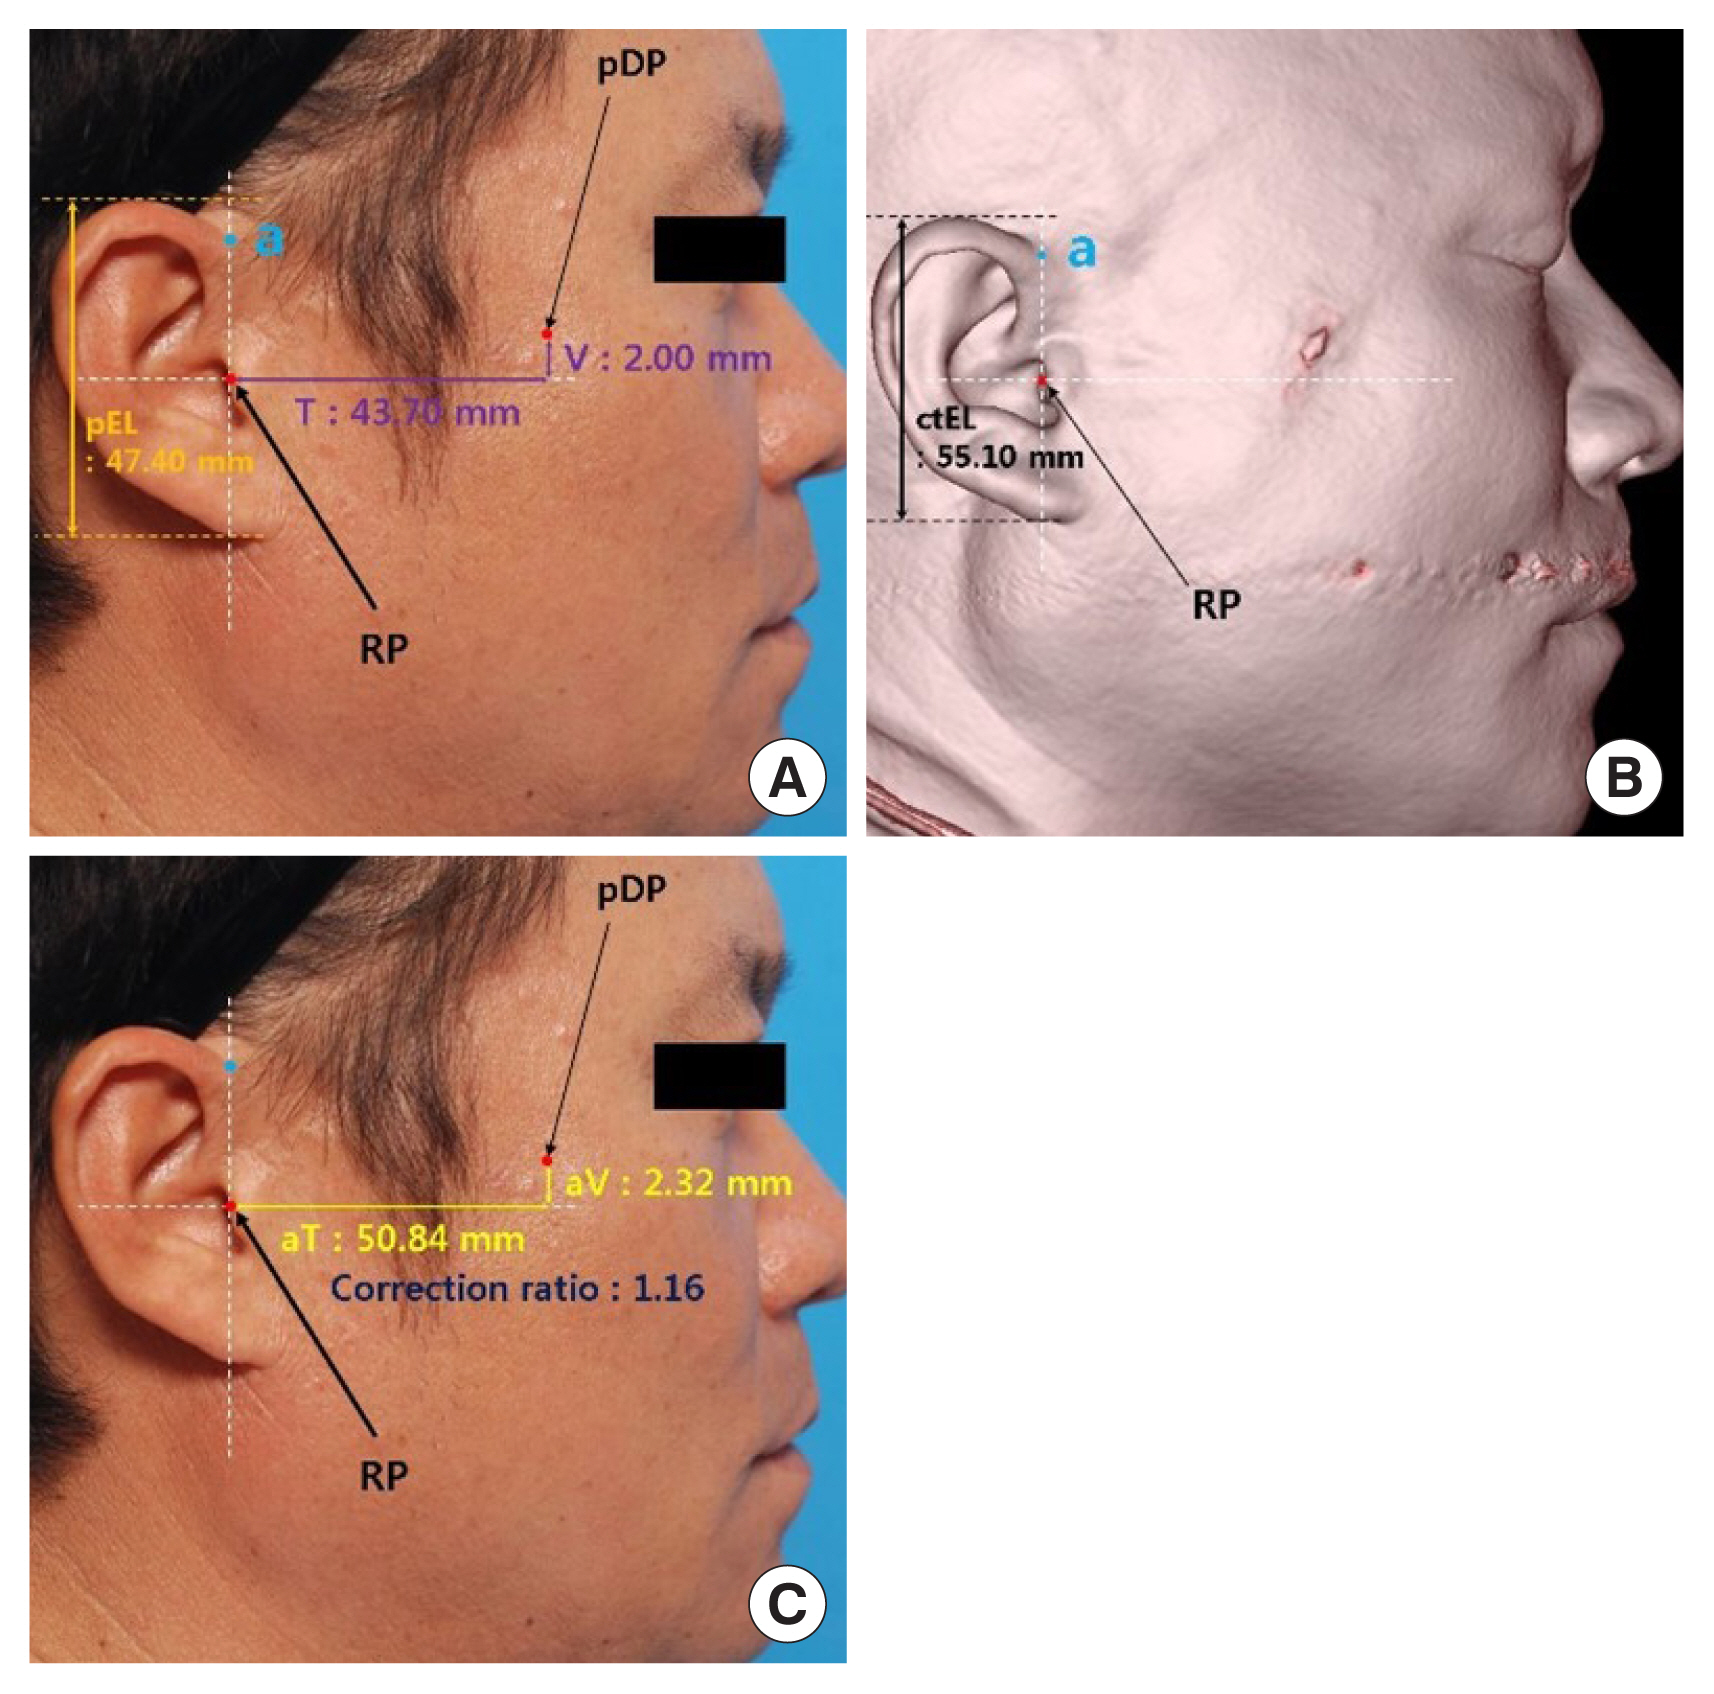
An example of the correction of the distance values measured on a photograph to calculate the actual length. (A) In this case, the ear length (pEL), transverse distance (T), and vertical distance (V) from the reference point (RP) to the most depressed location of soft tissue (pDP) on photograph are 47.40, 43.70, and 2.00 mm respectively. (B) The ear length (ctEL) on a 3D CT soft tissue image is 55.10 mm. (C) The correction ratio is 1.16, so the actual lengths of T (aT) and V (aV) are corrected to 50.84 and 2.32 mm, respectively.
Finally, we compared the distance between the location on the lateral cheek skin (pDP) and bone (bDP) using the values of transverse distance (aT, t) and vertical distance (aV, v) from the RP. This allowed us to estimate the degree of the discrepancy (Fig. 4).
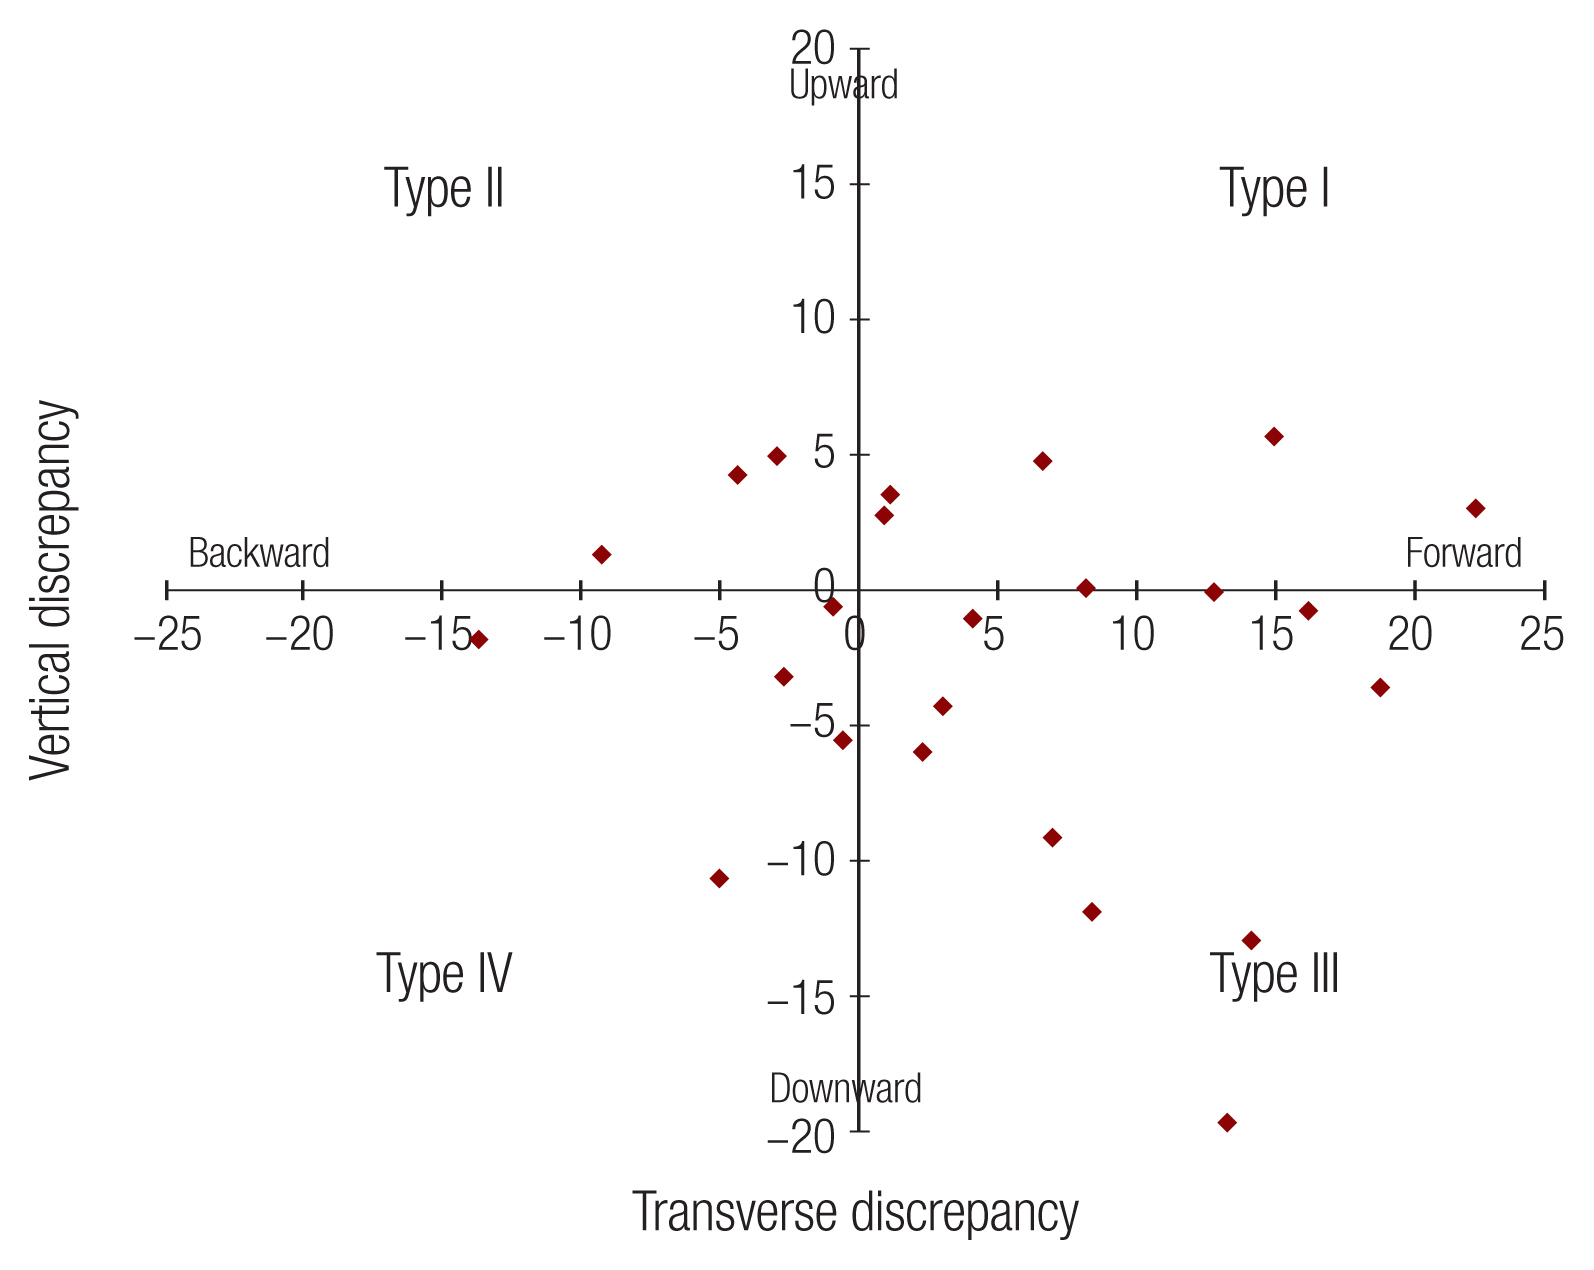
Diversity of locations of the most depressed location on the skin compared to the inward portion of the fracture on the bone according to an inspection. The most common discrepancy type was forward and downward, but there was no meaningful tendency.
RESULTS
Among the patients with isolated zygomatic arch fractures, only those with a fully visible ear on a side-view photograph were included A total of 24 patients met the inclusion criteria. There were 18 male patients, corresponding to a male-to-female ratio of 3:1. The mean age was 50.65 years. Of the cases, 13 were injured on the right side and 11 on the left side (Table 1). In this study, the discrepancy represented the distance from the innermost displaced fracture of the zygomatic arch to the location of the depression in the skin on the photograph.
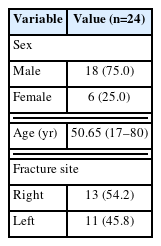
Patients’ demographic characteristics
An analysis of the discrepancy showed differences in the backward, forward, upward, and downward directions. On this basis, four patterns of discrepancies were defined between the location where clinical reduction would be performed based on the lateral cheek skin of the photograph and the maximally inward fracture location of the zygomatic arch—type I: a forward and upward discrepancy of the location of the soft tissue depression (six patients), type II: a backward and upward discrepancy (three patients), type III: a forward and downward discrepancy (10 patients), and type IV: a backward and downward discrepancy (five patients) (Table 2).

Four types based on the direction from the location of the innermost displaced fracture to the most depressed location on the skin, and the number of patients with each type
Compared to the location of the innermost displaced fracture on the bone (bDP) from the RP, the most depressed location on the lateral cheek (pDP) from the RP on the photograph was 7.45 mm forward and 3.28 mm upward for type I, 4.29 mm backward and 4.21 mm upward for type II, 10.66 mm forward and 5.15 mm downward for type III, and 2.61 mm backward and 3.27 mm downward for type IV (Table 3 and Fig. 4).
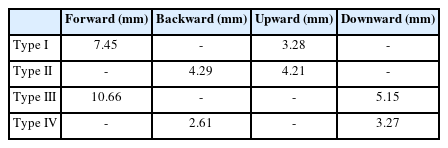
The direction and magnitude of the difference in each type
DISCUSSION
When difficulty of mouth opening or contour deformity is present, almost all simple zygomatic arch fractures are treated with closed reduction using a Dingman elevator through the temporal (Gillies’ technique) or intraoral (Keen’s technique) approach, except in cases of unstable or complicated arch fractures [3,5,6].
While the closed reduction method is relatively simple, it can be challenging to confirm the exact fracture location due to swelling of the soft tissue and muscles that can mask the inward portion of the fracture. This can lead to incomplete under-correction or unstable over-correction, resulting in asymmetric contour deformities or persistent functional deficits in mouth opening.
To address these issues, various methods have been introduced to confirm the exact inward fracture location and extent of reduction of the arch. Westendorff et al. [7] introduced the use of CT-based surgical navigation to compare the real and virtual bone positions, and other authors have demonstrated that using a C-arm or a mobile Fluoroscan can increase the accuracy of closed reduction by confirming the exact inward fracture location during surgery, although the issue of radiation exposure remains [8–11].
Other reports have shown that ultrasound is useful for diagnosing and managing zygomatic arch fractures, with a sensitivity of 88.2% and specificity of 100% in accurately assessing inward fracture sites of the arch [12], and have reported successful results for the closed reduction of zygomatic arch fractures using ultrasound and needle marking [13]. Therefore, as many authors have previously pointed out, it is important to not only assess the exact inward fracture location, but also to aim for precise reduction in order to achieve successful outcomes with anatomic reduction through closed reduction in even simple zygomatic arch fractures.
In general, closed reduction for simple zygomatic arch fractures is achieved by applying the opposite force of the injury vector to the indented area of the lateral cheek that is believed to be inwardly fractured, based on palpation and visual inspection. If the surgical result is poor despite appropriate reduction, it is possible that the vector of reduction was misrepresented or the wrong portion was reduced, rather than the actually depressed portion of the bone. However, due to the varying swelling of the soft tissue and muscles in each patient, it can be difficult to detect the exact location of reduction around the fracture site with visual inspection alone.
Meanwhile, Nam and Jung analyzed the main classification criteria for isolated zygomatic arch fractures (injury vector, V-shaped fracture, coronoid collision) from five previous studies, and presented a modified classification into six types by subdividing zygomatic arch fractures. In this study, in order to target fractures with an apparently clearer indentation portion on the lateral cheek skin, only patients with isolated zygomatic arch fractures corresponding to type V (i.e., a V-shaped fracture with depression of the middle portion and bone displacement with fracture lines or greenstick fractures due to injury, with the force vector directed toward the middle portion with or without coronoid impingement) in the Nam and Jung classification were included.
To detect the real inward fracture site of the zygomatic arch on the skin of the lateral cheek, we evaluated the agreement between the location of depression on the lateral cheek judged to be reduced and the actual inward location of the bone in the real fracture site using the soft tissue images on the 3D reconstruction format and the 3D bone images, which were converted on the same screen image of the CT scans. We compared these with the distance and location on photographs as described above. While it is easier to measure the distance using soft tissue images on the 3D reconstruction and bone images on CT scans taken immediately after the trauma, the measurement of the distance on the lateral cheek was made using patients’ photographs taken 1 day before the operation to minimize error caused by swelling.
Since, as found in this study, the transverse and vertical distances between the soft tissue and the bone depression differed in all cases, and these differences showed four types (forward and upward, backward and upward, forward and downward, and backward and downward), it is necessary to more accurately detect the location of the actual inward portion of the fracture of zygomatic arch fractures, even though the most common pattern of discrepancy was directed forward and downward, albeit without a meaningful tendency.
Therefore, to help accurately position the Dingman elevator in the actual inward fracture location, an RP in the 3D soft image was determined, and that image was converted to a 3D bone image to check the distance (t and v) from the same RP to the most inwardly depressed fracture location. We suggest that better surgical results could be achieved by inserting a Dingman elevator at the point identified by feeling with one’s fingertips to identify the most depressed location, taking the same RP on the patient’s face, and marking a point at the location of the t and v distance.
A limitation of this study is that the identification of the most depressed portion visually on the photographs and the location of the innermost displaced fracture on the 3D reconstructed bone images is subjective. To minimize this error, three plastic surgeons independently marked the most depressed portion both on the photographs and CT images, and the mean values of distance from the RP were used in this study.
Another limitation is that each patient had a different angle in their profile picture, making it difficult to align the 3D CT image evenly when positioning it in the side view. Therefore, for each case, the 3D soft tissue image of the CT scan was aligned to be on the same profile plane as the side-view photographs. The RP was then set on the side soft tissue images in the same way as it did on the side-view photographs.
This study showed tendencies in the discrepancies between the locations of the depressions on the soft tissue and bone. Applying the transverse and vertical distances measured from a bone image of the CT scan onto a patient’s face at the indicated RP will be helpful for predicting the reduction location. Nonetheless, this study has limitations, and it will be necessary to conduct further research with a larger sample size and more accurate and consistent measurements methods between the soft tissue images of 3D CT and photography, including even alignment of different angles, the correction of size differences, and the determination of a constant RP.
Notes
Conflict of interest
No potential conflict of interest relevant to this article was reported.
Funding
None.
Ethical approval
The study was approved by the Institutional Review Board of Daegu Catholic University Medical Center (IRB No. CR-22-157-L) and performed in accordance with the principles of the Declaration of Helsinki. The informed consent was waived.
Patient consent
The patients provided written informed consent for the publication and use of their images.
Author contributions
Conceptualization: Dong Gil Han, Yong Jig Lee, Sung-Eun Kim, Jeong Su Shim. Data curation: Yong Jig Lee, Se Hun Kim. Formal analysis: Yong Jig Lee, Dong Gil Han. Methodology: Sung-Eun Kim, Jeong Su Shim. Investigation: Se Hun Kim, Sung-Eun Kim, Yong Jig Lee. Resources: Dong Gil Han. Supervision: Dong Gil Han, Jeong Su Shim. Writing - original draft: Dong Gil Han. Writing - review & editing: Yong Jig Lee, Se Hun Kim, Sung-Eun Kim, Jeong Su Shim.
Abbreviations
3D
3-dimensional
CT
computed tomography
RP
reference point